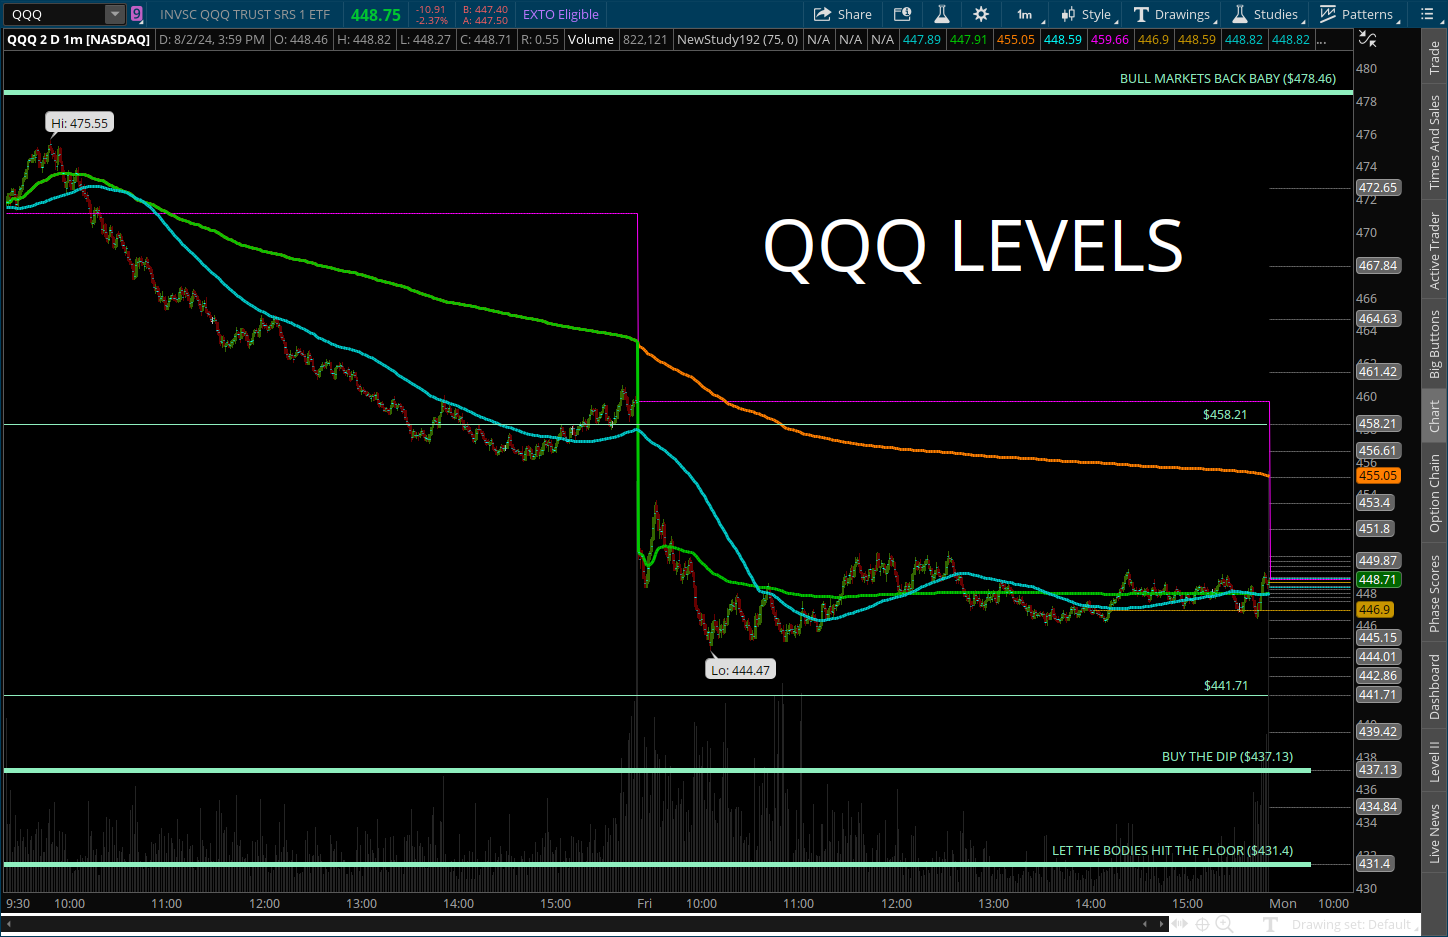
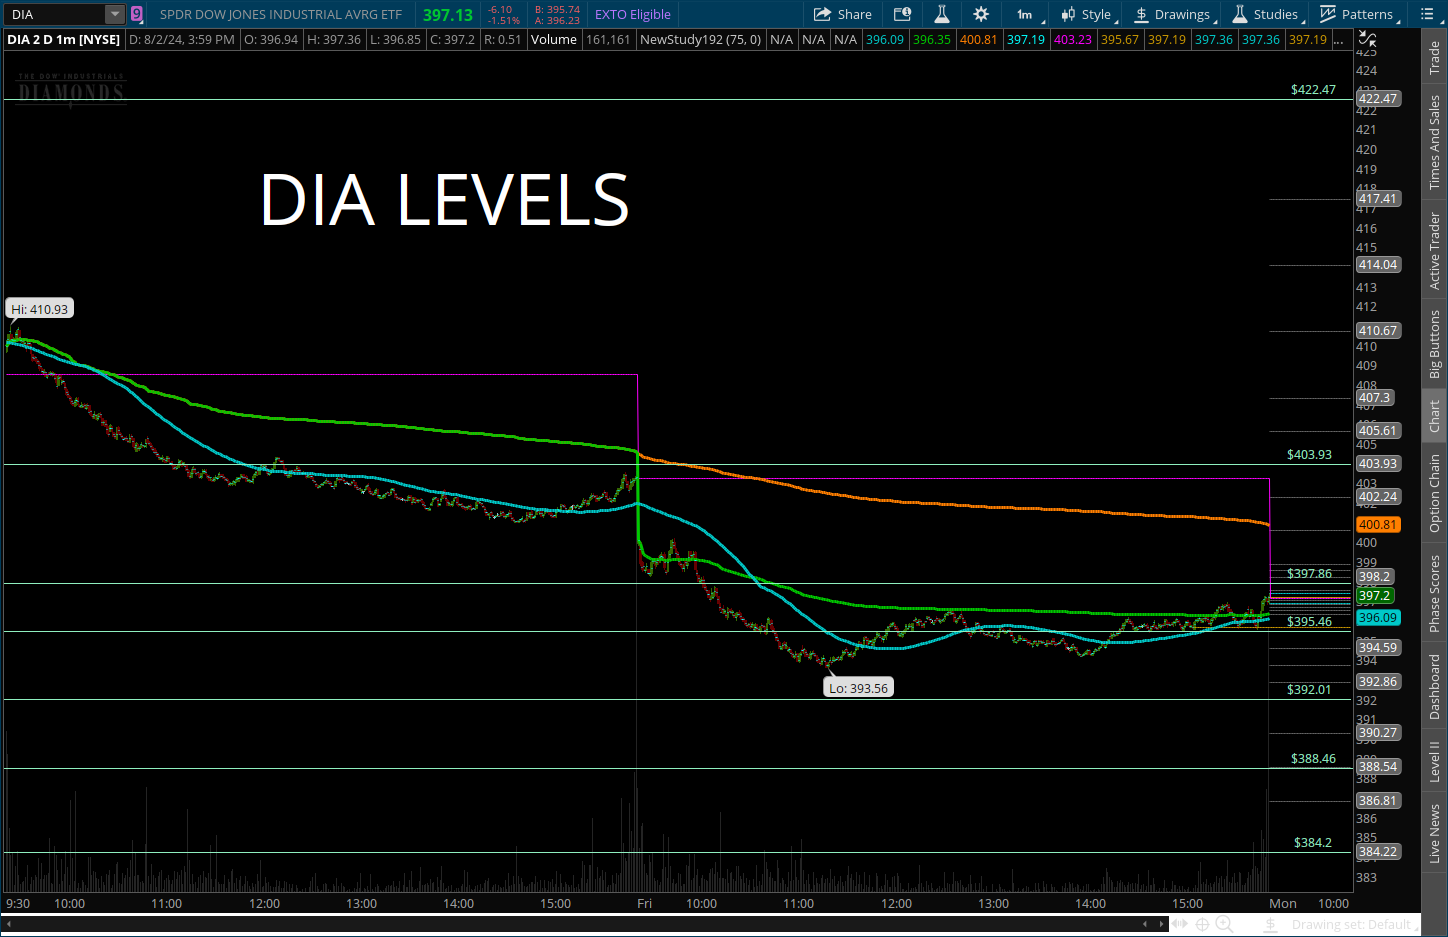
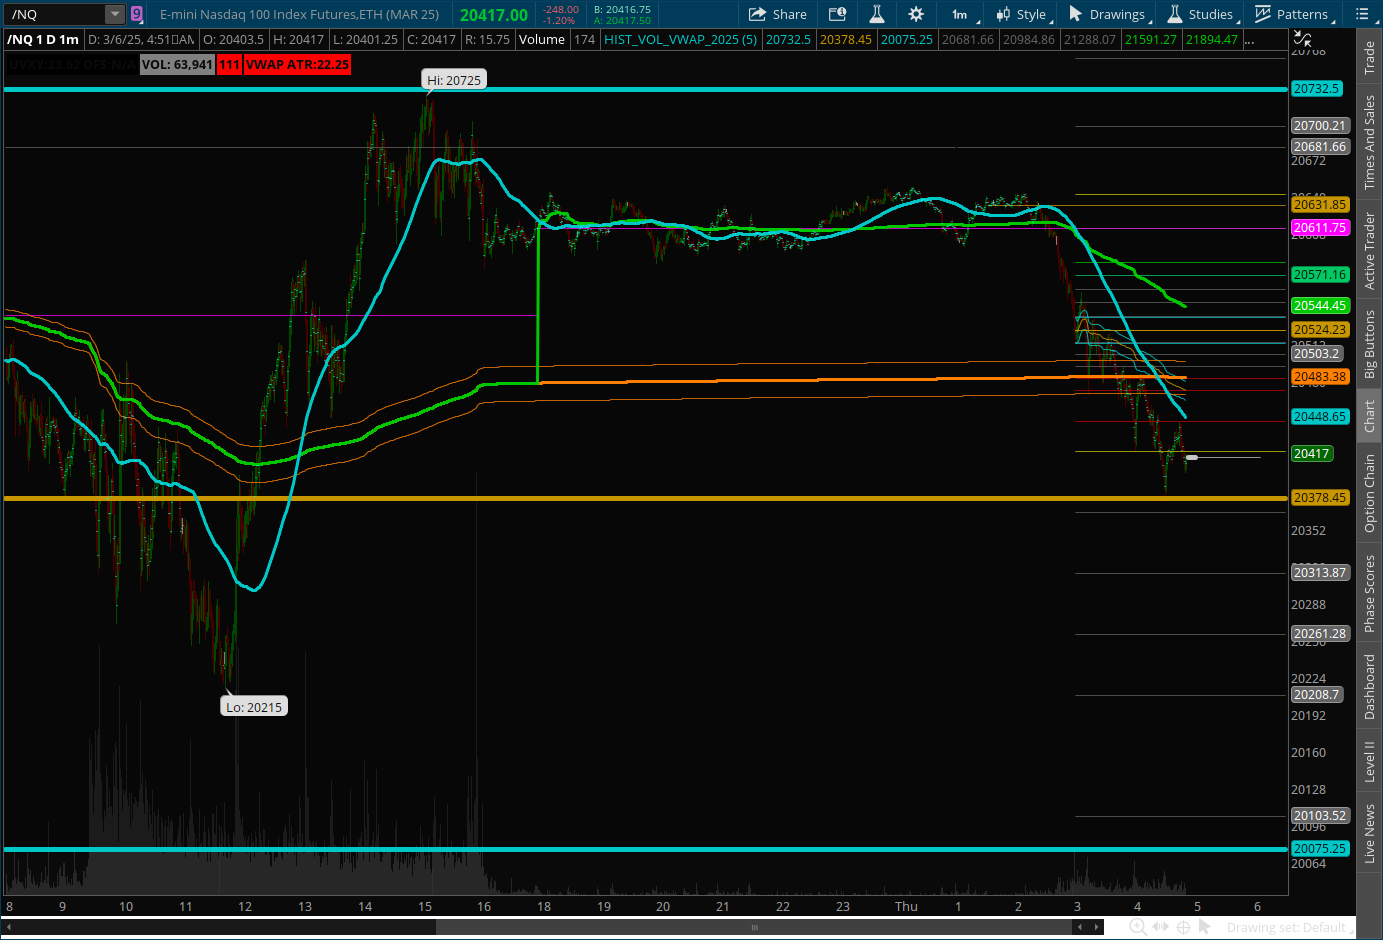
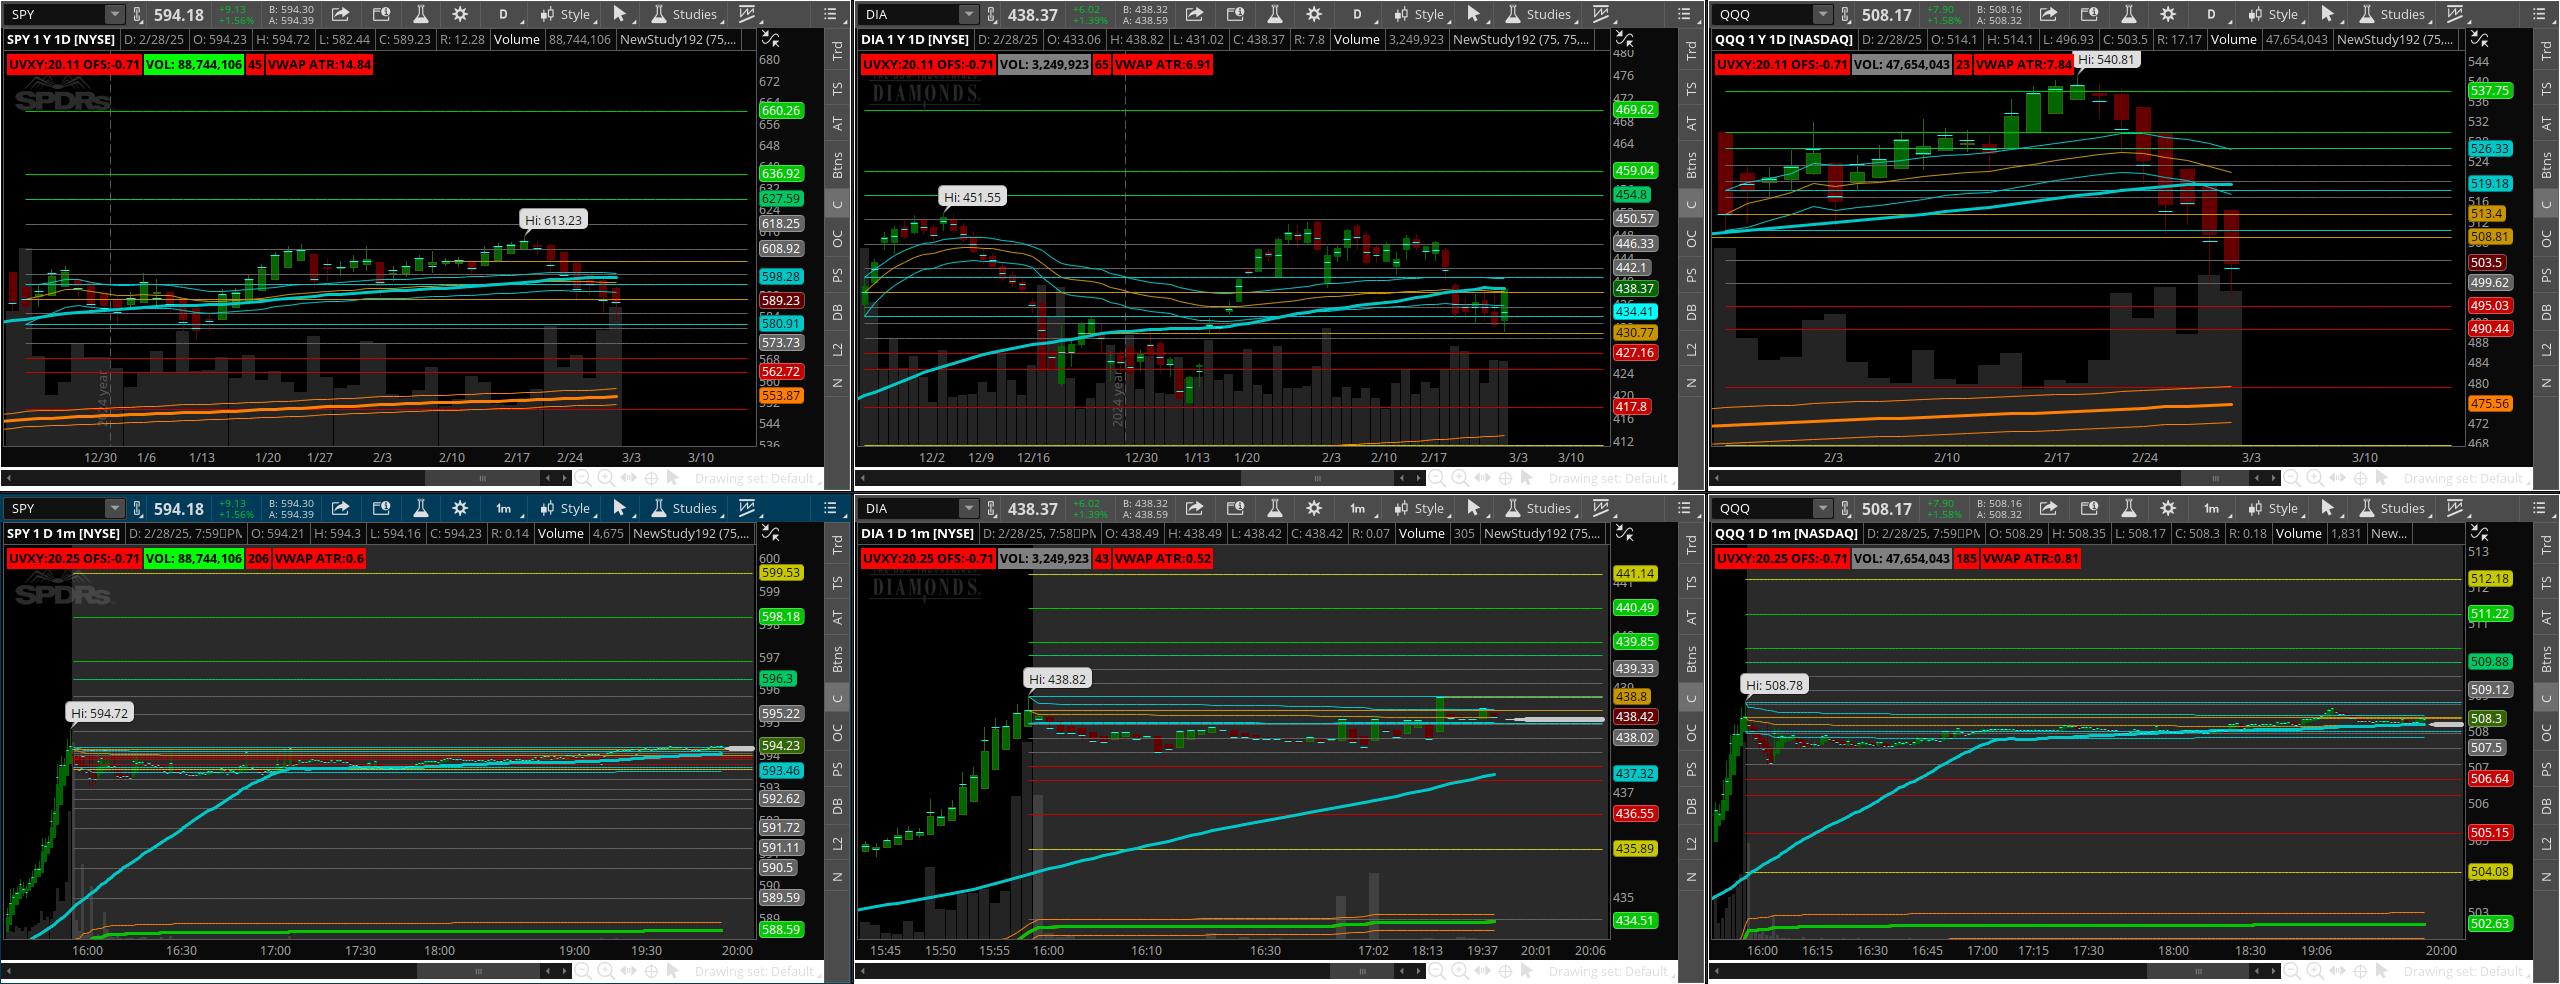
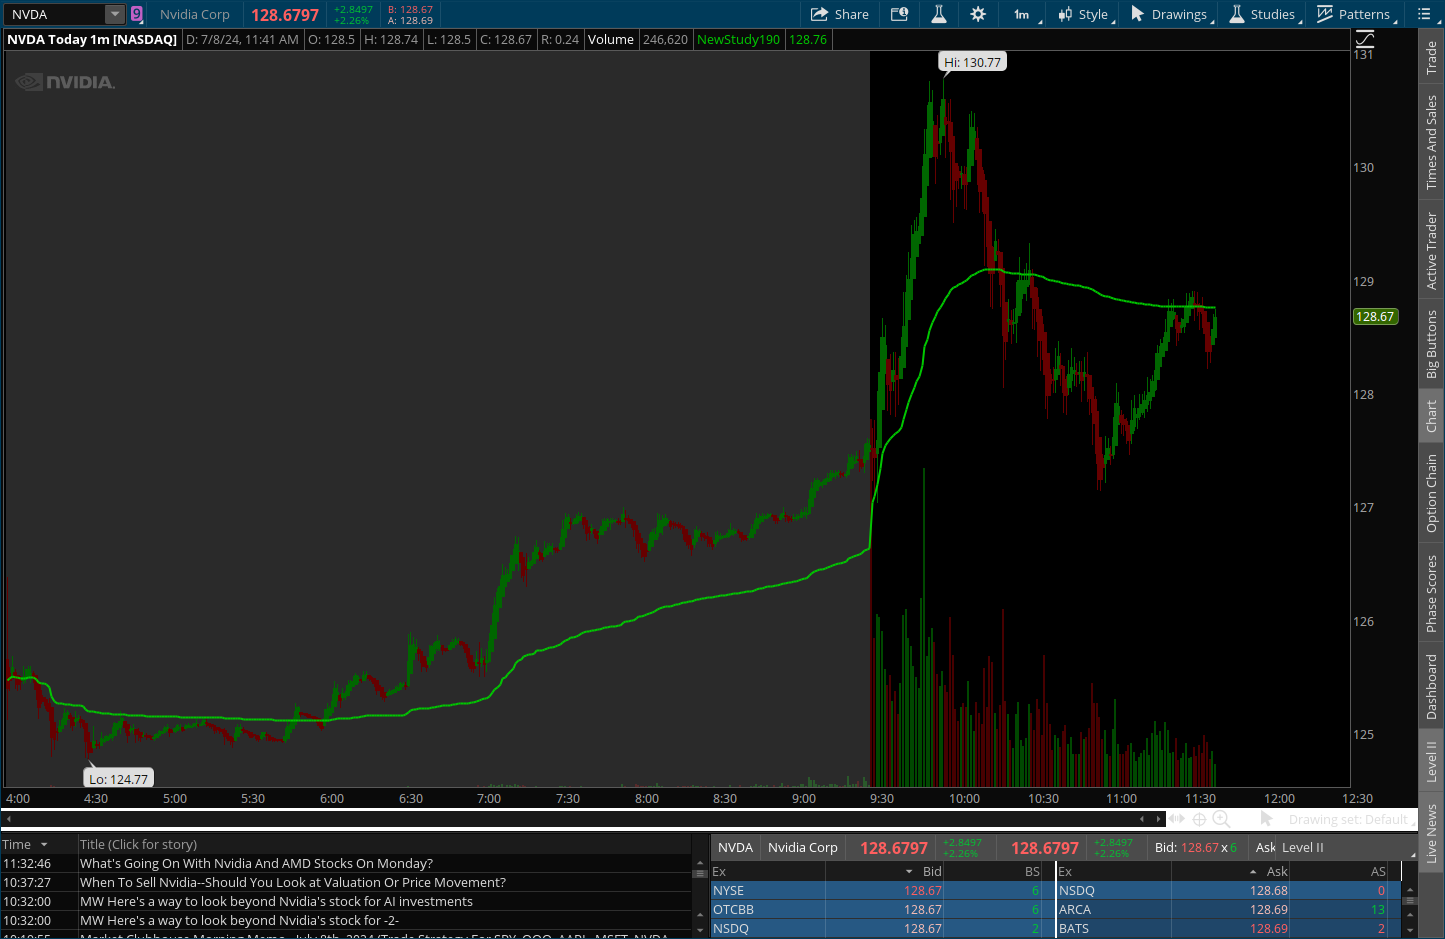
Most trading platforms offer a standard VWAP indicator, usually found under what are known as STUDIES.
STUDIES are codes or scripts that compile price action data and draw an indication of that computation on charts. These predefined scripts can sometimes be modified by how the script is written and may offer the ability to change some values by the user selecting from dropdown menues or entering variable data to fine tune the desired output of the indicator.
Below are examples of the different types of indications that can be created using VWAP based on how VWAP is being aggregated and from where VWAP is being aggregated from.
Standard VWAP
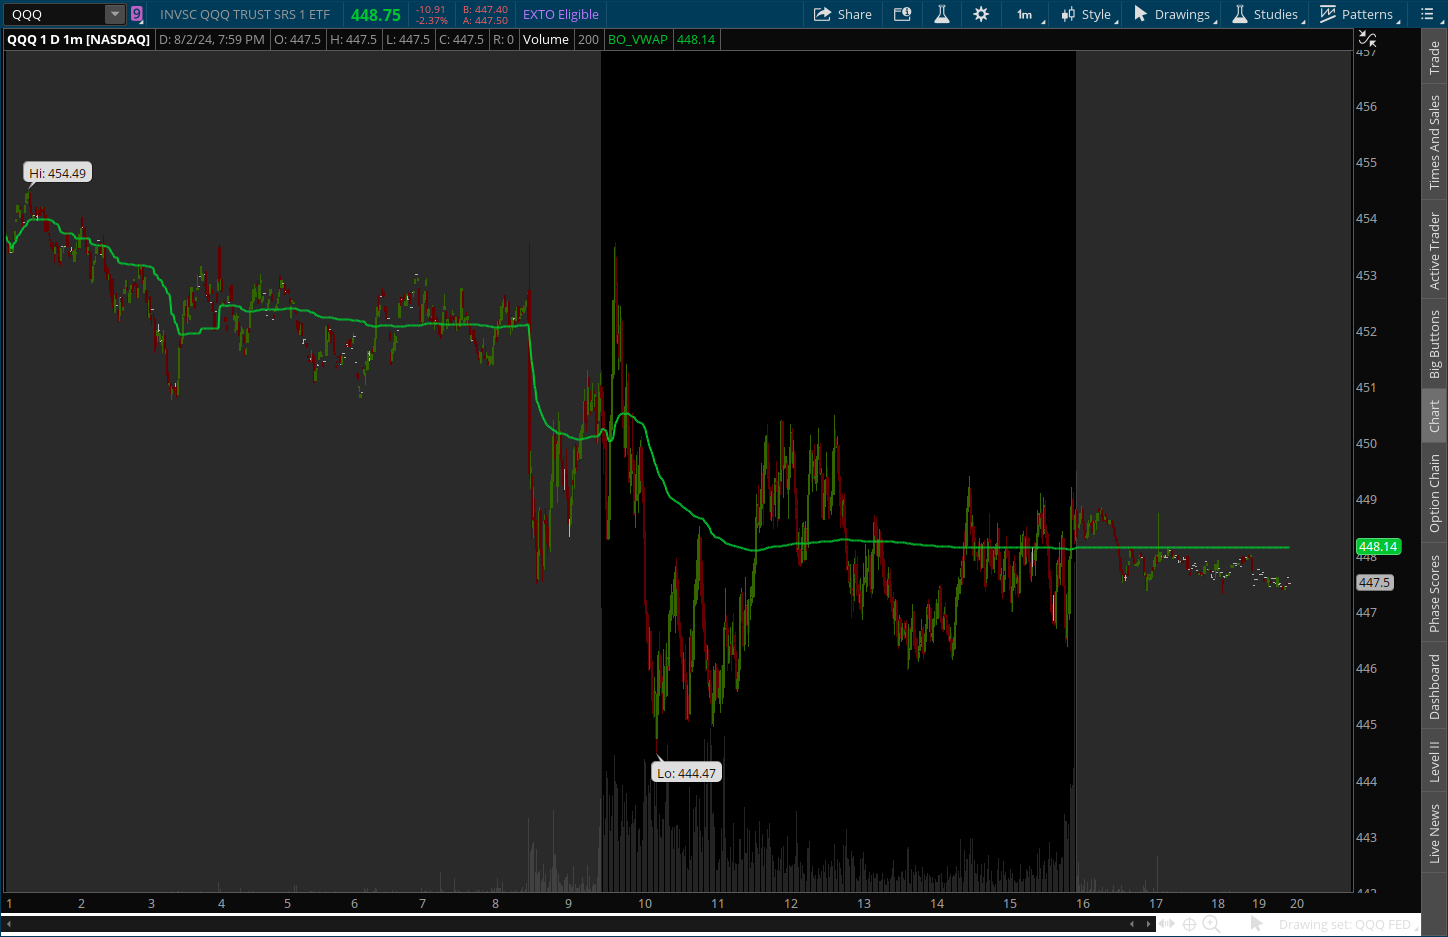
The standard VWAP shown below in green is anchored to the first print of the selected session, and is used to realize where fair market value can be observed on an ongoing basis as it's re-calculated throughout the day. This is referred to as the INTRA-DAY VWAP.
Intra-Day VWAP allows us to visualize whether or not buying or selling pressure can be observed relative to where fair market value is, and defines who's in control of the stock at any give period throughout the day, The BULLS or The BEARS.
If we are considering a long position, we would want to see that there is buying pressure at or above fair market value, and like wise if we are short we don't want to remain committed to the short side if price action is trending above the vwap, indicating that the buyers are supporting elevated prices.
VWAP IS NOT a buy or sell indicator, but a tool used to deturmine whos in control of the stock, such that we can use it to help support our long or short thesis.
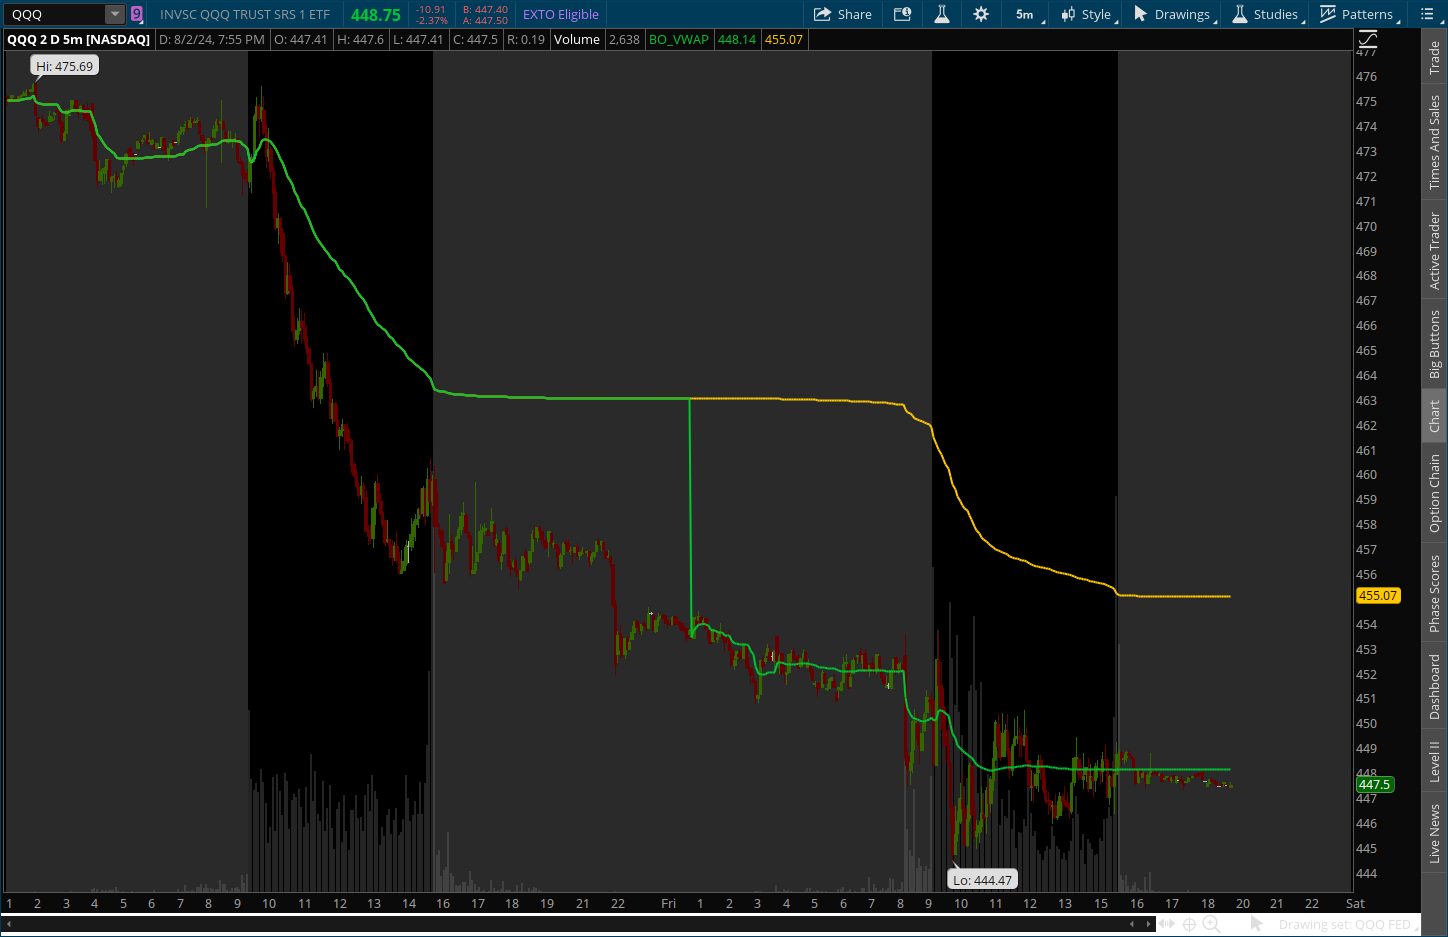
MULTI-DAY VWAP
The Multi-Day VWAP or Multiple Periodicity VWAP shown below in orange begins its aggregation from where the VWAP ended from the prior session and continues its aggregation incorporating all of the new price action and volume data of the current session. Resulting in a day over day observation of fair market value.
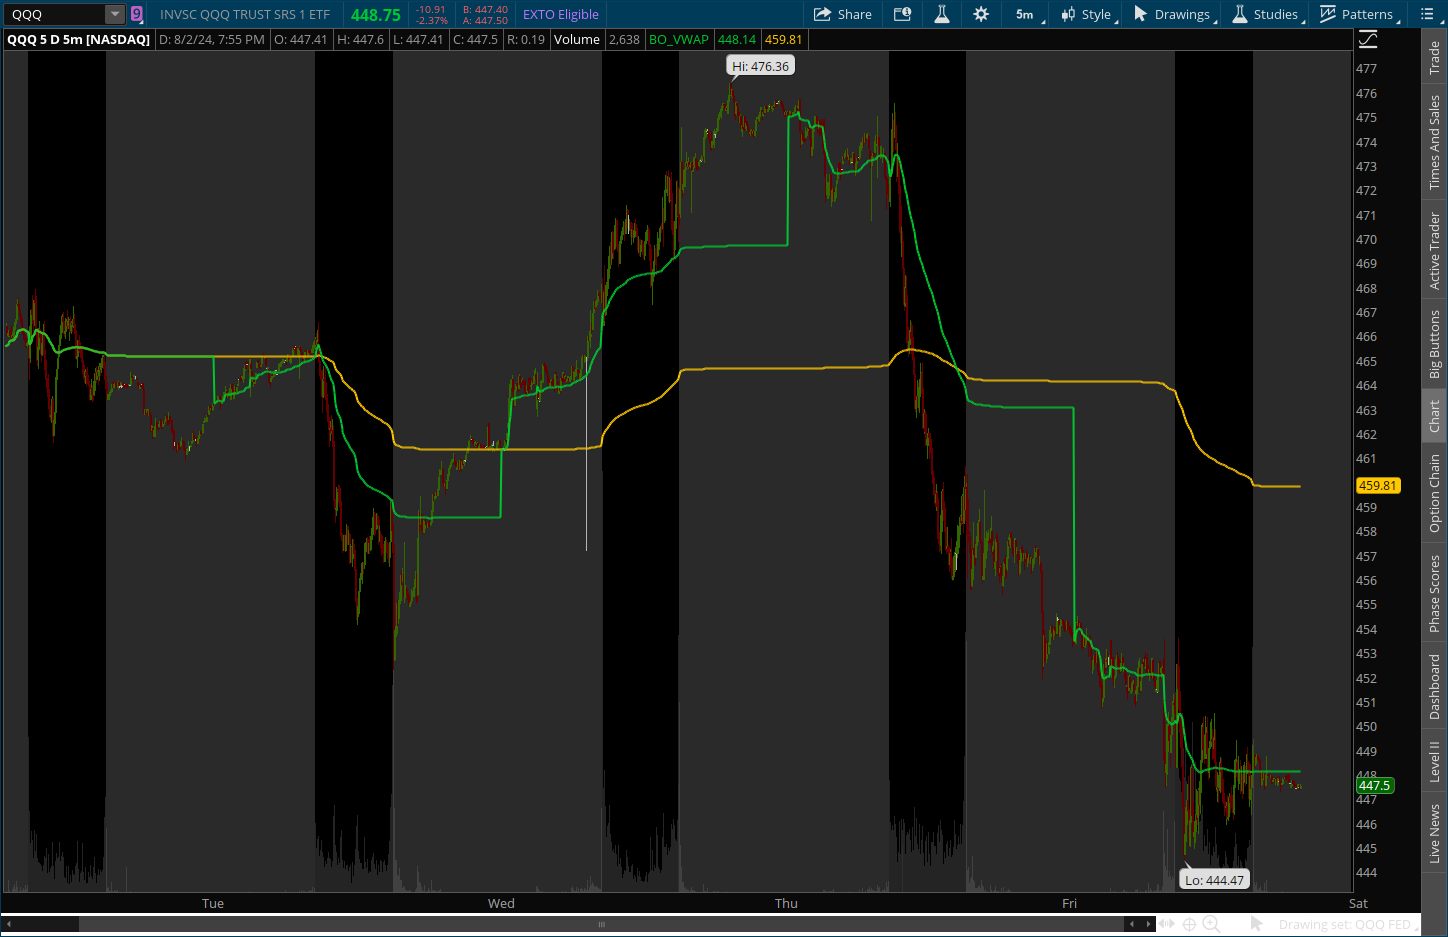
The following chart displays how a multitude of days can be aggregated to show where fair market value of a given larger period of time can be realized, in this case, five trading periods resulting in a five day recocnitions of price discovery or fair market value.
On this next chart we have aggregated a much larger period of time, in this case a years worth of price action data, and using daily candles to create a one year reconciliation of where fair market value can be observed.
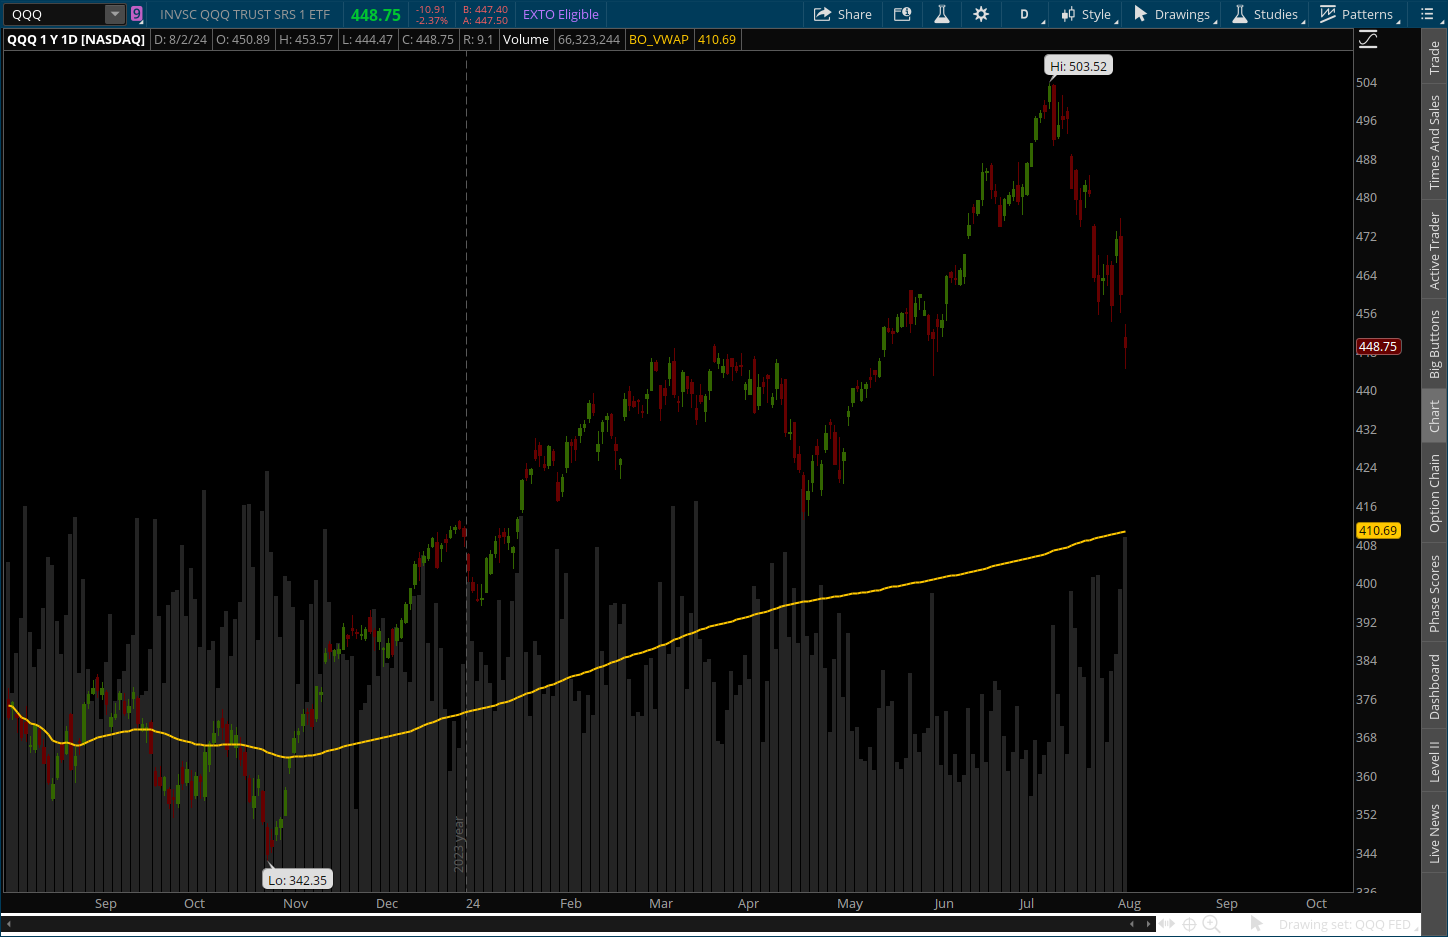
The following chart now extends its aggregation out to a five year period resulting in a five year aggregation of price action resulting in an even larger evaluation of where fair market value can be observed.

ANCHORD VWAP
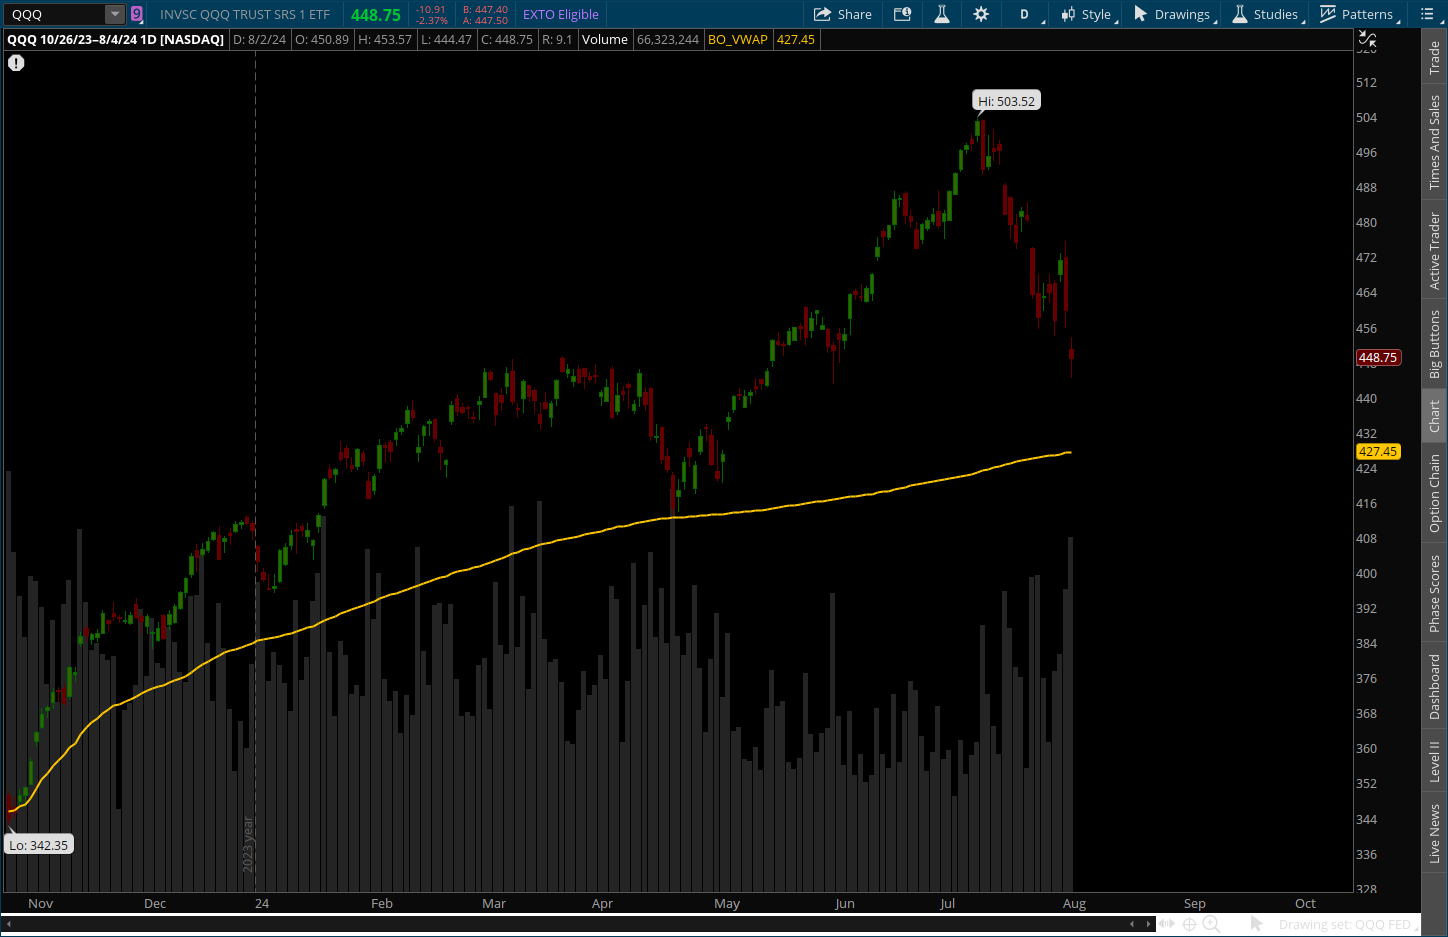
Anchoring VWAP or Time Stamping VWAP can be very useful for deturmining what the ongoing sentimate is for a given stock from a very specific HOT DATE or EVENT DATE. In this example we are going to anchor our vwap to a very specific date. Unlike generic periods of time such as one day, five days, one year, five years, etc., a HOT Date can become very telling with regards to what the new sentimate is and how the stock is performing relative to that event.
In the example below we are looking to understand whether or not there is buying or selling pressure relative to our nominated starting point. We will have aggregated the chart to reflect a starting point of October 19th 2023, the actual low within a one year period. Note that since that anchor point we did indeed have buying pressure to the upside, and a reversion to the VWAP to test for fair market value price discovery. Also to note is how the market responded to where it pulled back to and it would appear to show that from an ongoing stand point VWAP did indeed declare THIS IS where fair market value IS and this is where the buyers stepped in and began to re-accumulate the stock, after evaluating the following question. Are buyers willing to step in here at fair market value or not? in this case the answer was YES.
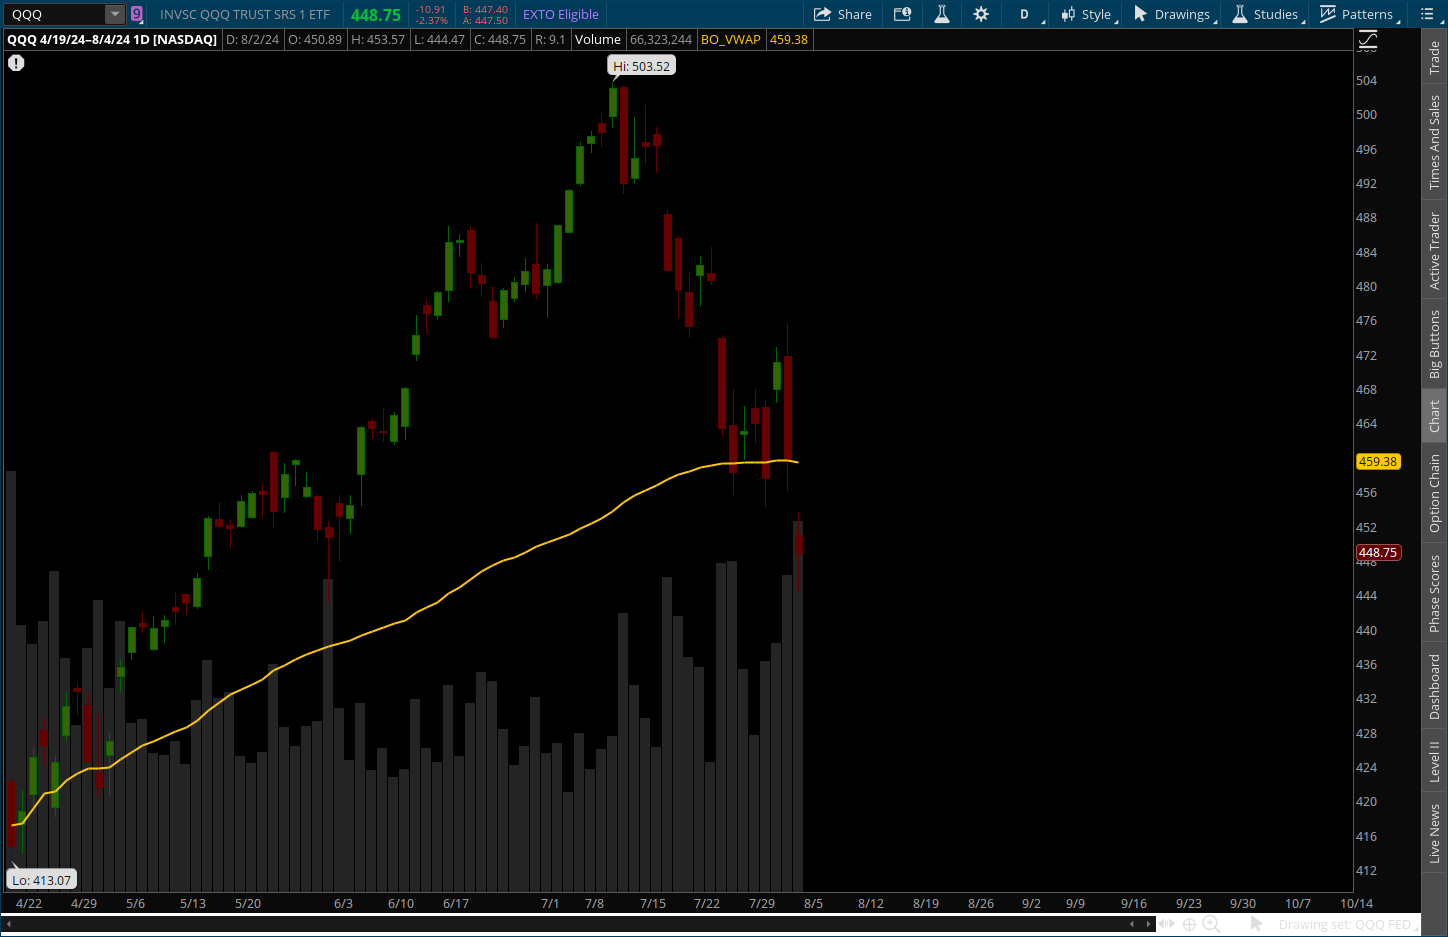
For this next example we are going to continue to use the same premise of a HOT DATE or EVENT DATE to re-calculate the chart to that pivot point where price action reverted down and tested the VWAP, essentually resetting the bar where the new price discovery can be observed. This new EVENT DATE was April 19th 2024, and in an ongoing manner defined where newly minted fairmarket value could be referenced.
This time price action reverted down to the VWAP and was presented with the same question we asked before. Now that we are back to fair market value are buyers willing to step in and aquire at or above this newly derived fair market value price discovery level? The apparent answer is NO they were not commited to this price discovery level and they look to find better value at a lower level, potentially back down to the prior vwap indication from when it was anchored to the October low.
A very important thing to consider here is what price action did when it reverted back to vwap and bounced off of it initially, before following through. You will come to understand that this was a profit taking event, where the shorts decided to cover, which is essentually buying the stock back, but notice even though there was buying it was not met with real buying pressure causing the price to considerably move back up due to an absence of inventory. It can be seen clearly that this is just an absence of buyers willing to step in and bid the stock higher resulting in a continued lower search for price discovery at a lower yet to be deturmined fair market value price.
We have now looked at a few examples of how anchoring to prior pivot points or HOT DATES can suggest where support can be observed, now we can look at how resistence can also be defined by anchoring our VWAP to the highest pivot point of the chart, in order to recognise where recovery to the upside can be realized. But just as importantly we can use this pivot point to signify where our stop can be defined if we were short from a topping formation.
To define this further, we are considering what fair market value is relative to the high, and our VWAP signature defines for us where that price discovery level is, and potentially use this levels as a trailing stop. From this stand point the question remains the same, are there buyers at or above fair market value relative to this HOT DATE?
In this example we could conclude the answer to be NO. With that in mind you can ask another question... Do I want to remain short if price action begins to trend back above VWAP? Smart Money would and should offer a resounding HELL NO!

EVENT TARGETED VWAP
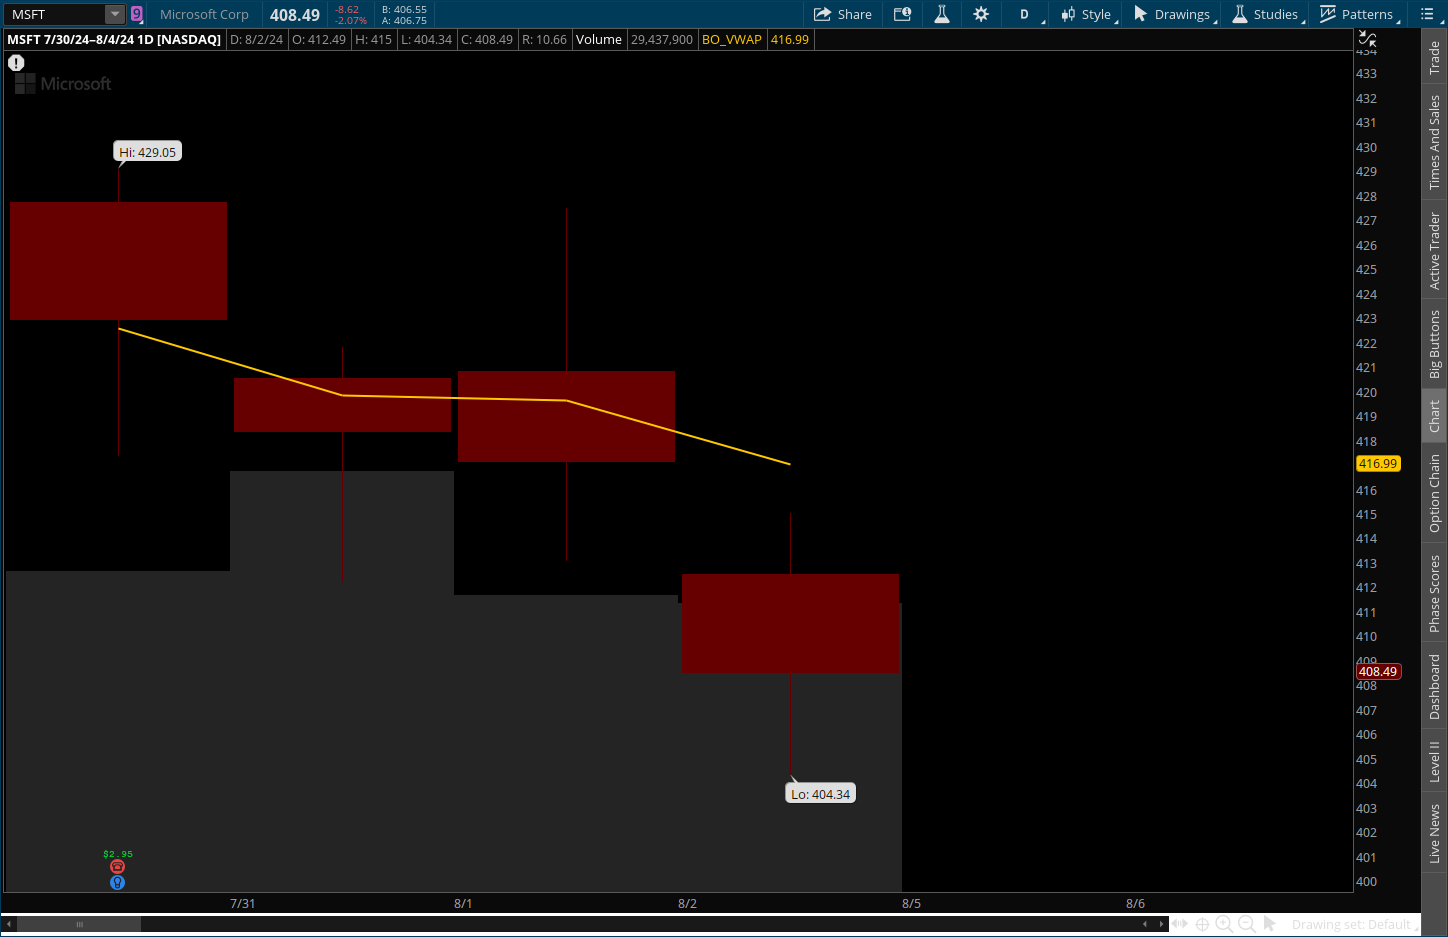
Event targeted VWAP is an anchoring process where you set your aggregation date to that event specific date. In the case below we have anchored the VWAP to the date of the last earnings report, and in doing so we can see what smart money has concluded about their continued support for this stock since the last earnings period, and where their committment waned.
This methodology could also be employed to realize institutional sentimate relative to your portfolio holdings in order to reveal whether or not price support is intact since your entry. This can be achieved by deturmining the date you entered your position and monitor the price action posture relative to the VWAP indiction from that entry date. From this perspective it can be very clear and easy to conclude how to manage you position.
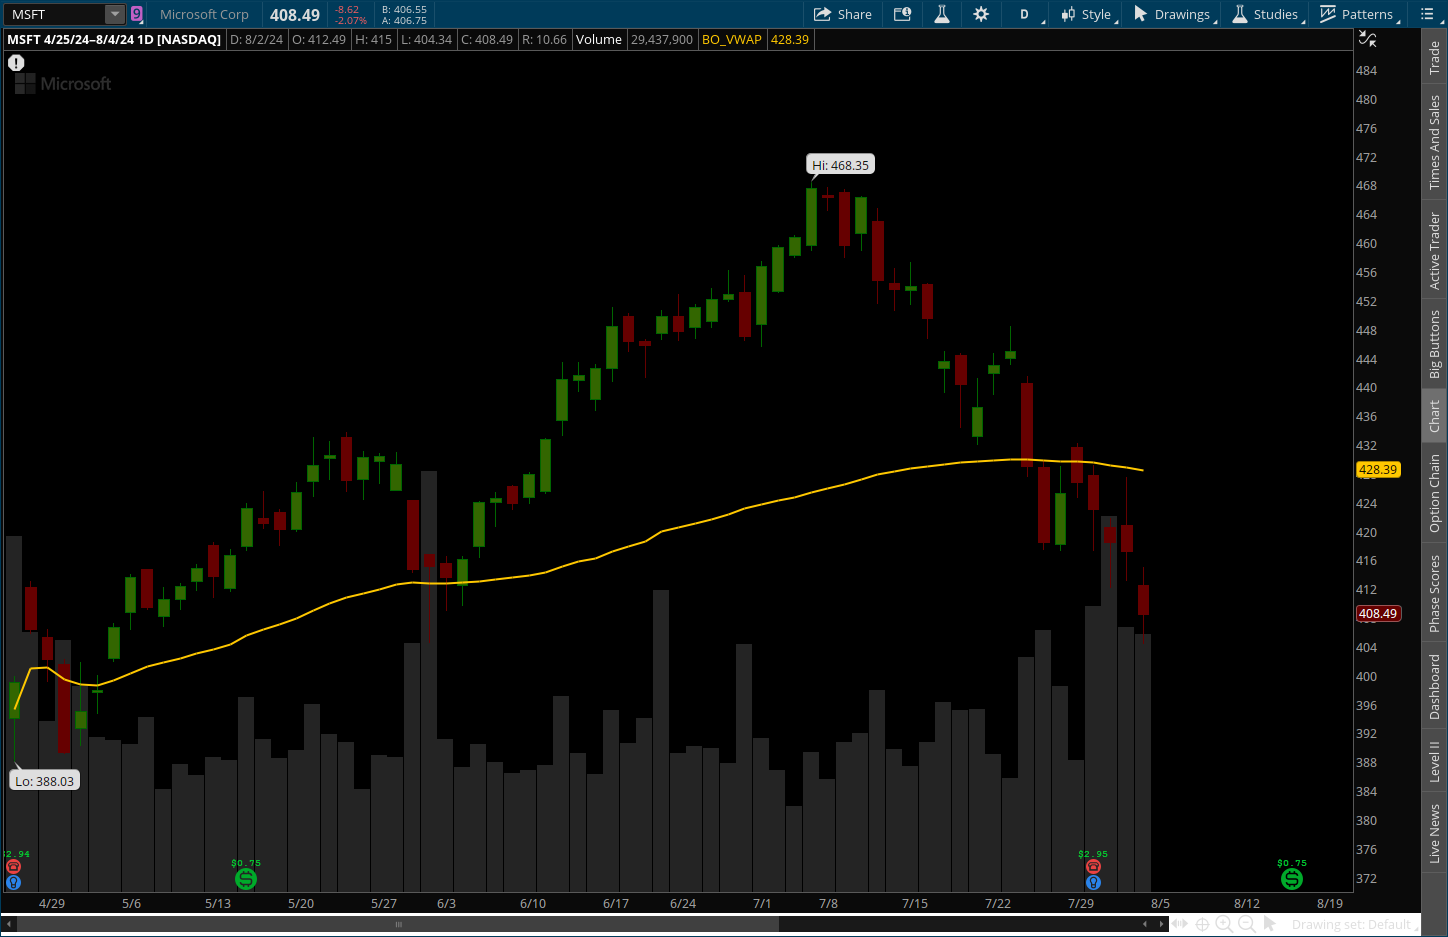
To further exeplify this strategy, the following chart is anchored to the most recent earnings report, and shows us SINCE this most recent event, in this case and earnings report, this is what smart money believes about this ongoing concern, and where there might be a possible and reasonable price in which to consider stepping in to a long position. OR, if you have been short sice the most recent earnings report (or HOT DATE), the VWAP signature relative to that reporting date will let you know that you may have over extended your welcome to the short side.
ADVANCED VWAP
Up until this point we have discussed VWAP from an inclusive intra-day perspective and on a more MACRO daily level perspective, showcasing what could be considered as the big picture in terms of identifying the bullish or bearish sentimate of a given day, a multitude of days, and even from one event to the next, but VWAP is also capable of defining much smaller and highly specific targeted time frames and all the way down to the VWAP signature of each candle.
Lets begin with understanding that vwap is an aggregation of price action and volume data over a specific period of time. The calculation of VWAP does not change, just the amount of data to be calculated.
As we have come to the understanding that VWAP represents price discovery and fair market value over time, the below chart showcases the HOURLY VWAP in BLUE.
The HOURLY VWAP is an aggregation of price action from hour to hour, NOT where vwap was an hour ago. In the same way that the Multiday derives its indication on a day over day basis, the hourly derives its signature on an hour to hour aggregation giving us a faster read of price discovery which can help us declare when shifts in sentimate in the near term occour.
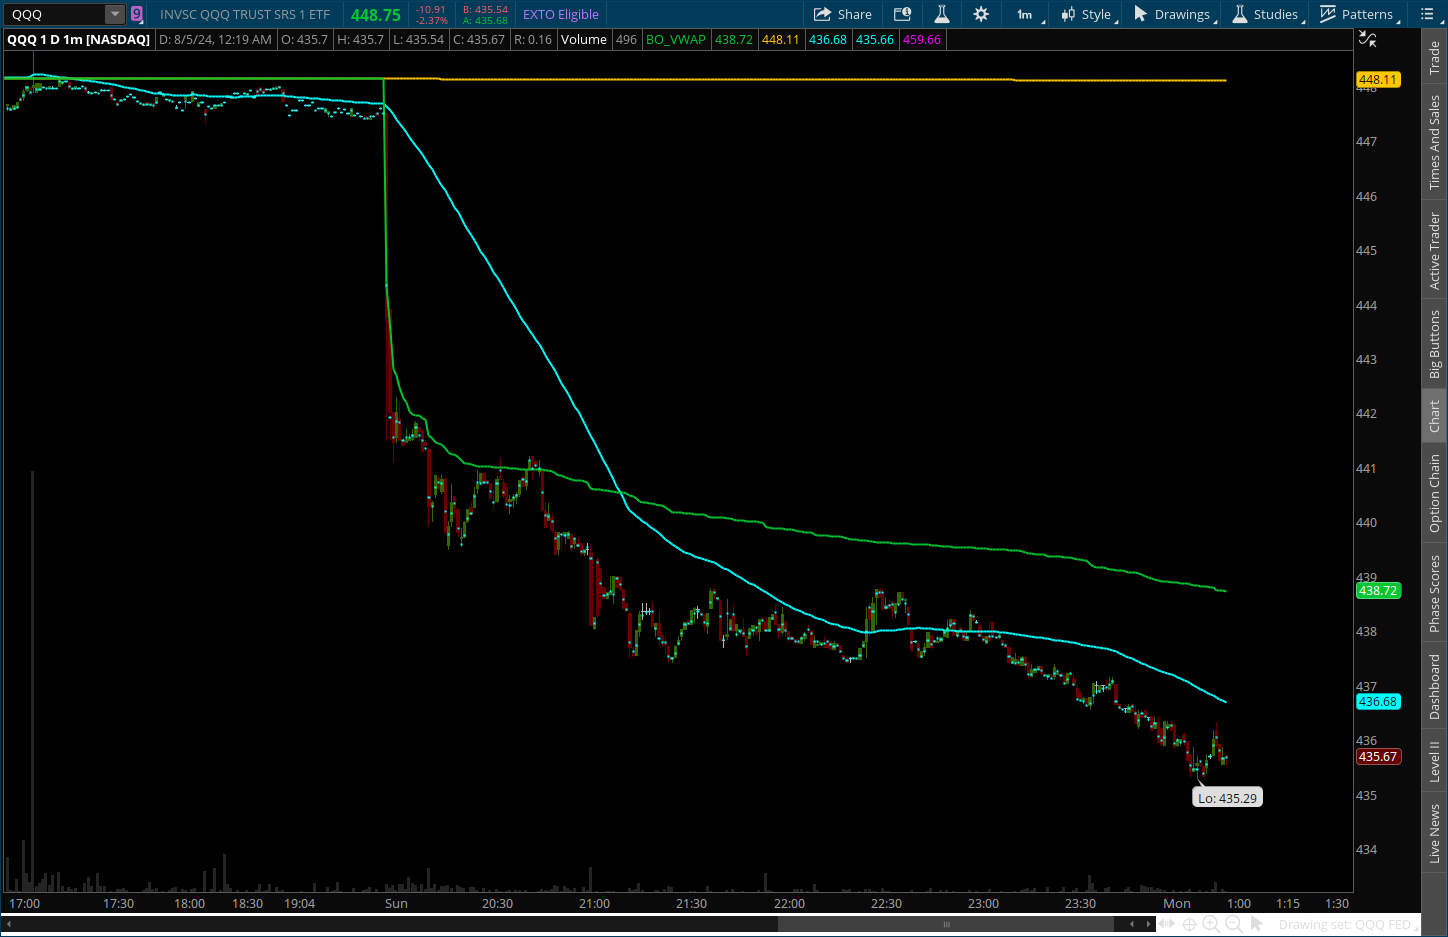
The hourly can help us define when tops and bottoms are forming by signaling that over this shorter time frame sentimate has begun to shift. Once again VWAP is not a buy or sell indicator, but more of a declaration of sentimate, and in the case of the hourly vwap we are trying to isolate the potential of a VWAP reversion by first declaring that sentimate has shifted from selling pressure to buying pressure, which can in the short term exemplify that current price action that was once just profit taking from the short sellers has indeed switch to actual buying pressure. This subtle difference is where the hourly shines.
The hourly gives us a heads up that a bottom could be forming by whitnessing price action begin to break above the hourly VWAP and set the bar for defining a future range to break. Once we see the onset of price action maintaining a baseline, and starting to ping the hourly, we can start to look for the key signatures that define a true bottom and that is when you maintain a closing posture above the hourly and also begin to break resistance ranges formed by prior hourly VWAP breaks.
The chart below explains how to define a true range break using CANDLE to CANDLE VWAP, or PRICE DISCOVERY VWAP, PD VWAP for short.
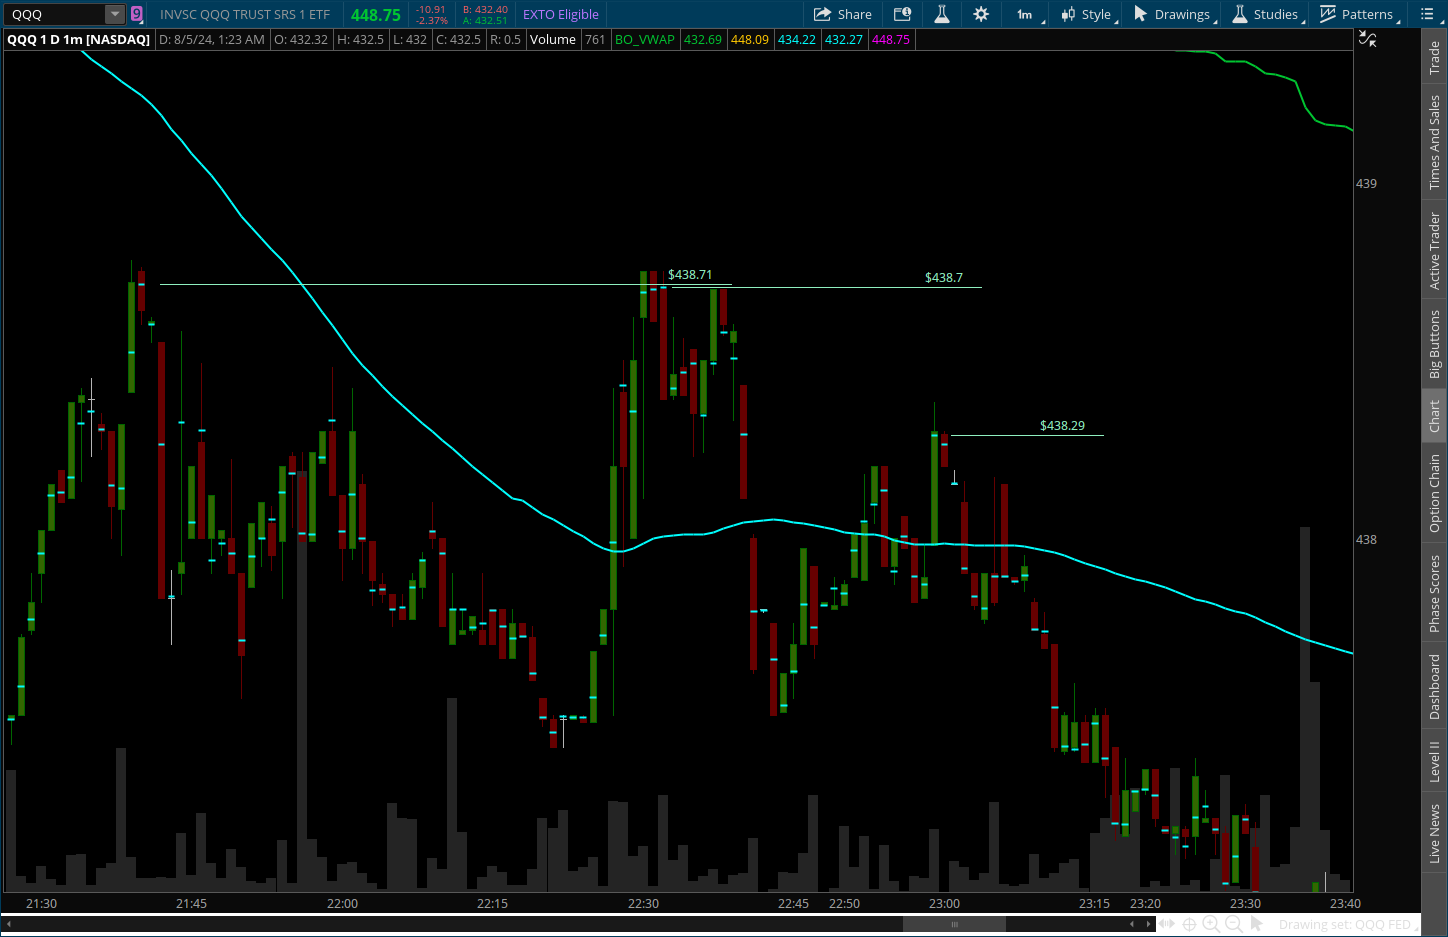
Each candle has its own VWAP signature, this can allow us to read into that chop and designate where the dominate highest price discovery (PD for short in the context of candle to candle VWAP) can be observed. As the chart shows price action did break above the hourly VWAP and set the BAR, but notice it did not break an earlier PD VWAP prior to breaking the hourly VWAP nor did it showcase a PD VWAP break following the hourly break, and then as it dipped back below the hourly and the rallied again it still was met with an absense of committed buyers indicated by a lower PD VWAP signature.
Automated VWAP Support and Resistance
The following tools are designed to provide Fully Automated Multiple Periodicity VWAP Support and Resistance Levels, and highly targeted Event Driven VWAP signatures.
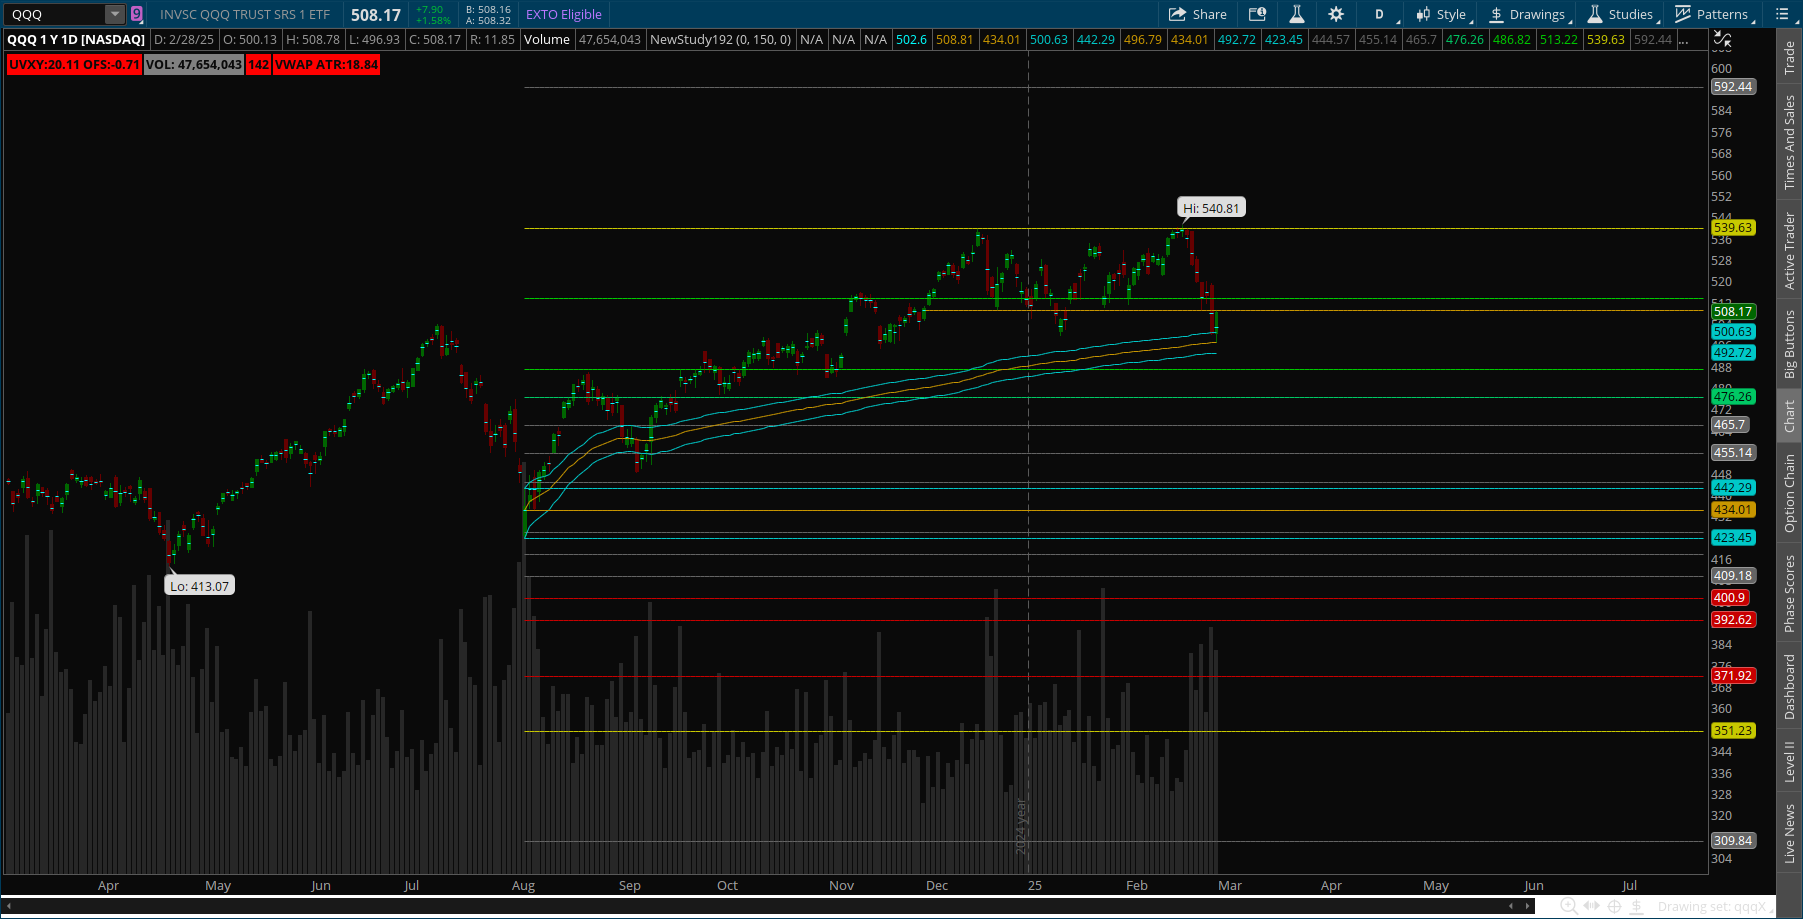
Combining all of the VWAP concepts into one study, this chart automatically defines market sentiment from the highest volume VWAP event over a selected time period, and maps out the most dominant algorithmically derived price discovery support and resistance levels defining with high probability where a market reactionary event will happen. Market reactionary events can be considered short and long term potentials where prices can rise or fall to related to profit taking events.
In the above Example, the high volume event on Aug, 5th 2024 defined all of the levels going forward, indicating where price action could expect a reactionary event to occour, and showcasing where price action observed support and resistance. Notice that these levels projected a target well above the July 10th 2024 All Time High, prior to price action ever being there before.
In addition to the support and resistance levels, the trending VWAP indicator also begins its aggregation from that same high volume event, allowing us to visualize where fair market value or price discovery can be observed from that primary event, defining who is in control of the stock, the BULLS or the BEARS. This indicator produces three signatures relative to the high volume event candle, a Vwap signature from the high of the candle, the price discovery or VWAP of the candle, and from the low of that candle, to produce what can be considered the VWAP SHUFFFLE RANGE. These upper and lower ranges above and below the VWAP siganture help visualize whether or not support or resistance is being maintained. these upper and lower bands help to quantify follow through when negotiating a VWAP break out or break down.
For added clarity, consider the price discovery or VWAP of each candle as defining where fair market value is on the fly, and then consider that each support or resitance level, and trending VWAP levels express where fair market value can be observed. Understanding the dynamics of both registrations, you can conclude that if the current price discovery for and given candle exceeds the dominance of any linear or trending price discovery level, we could conceed that the range is now being broken.
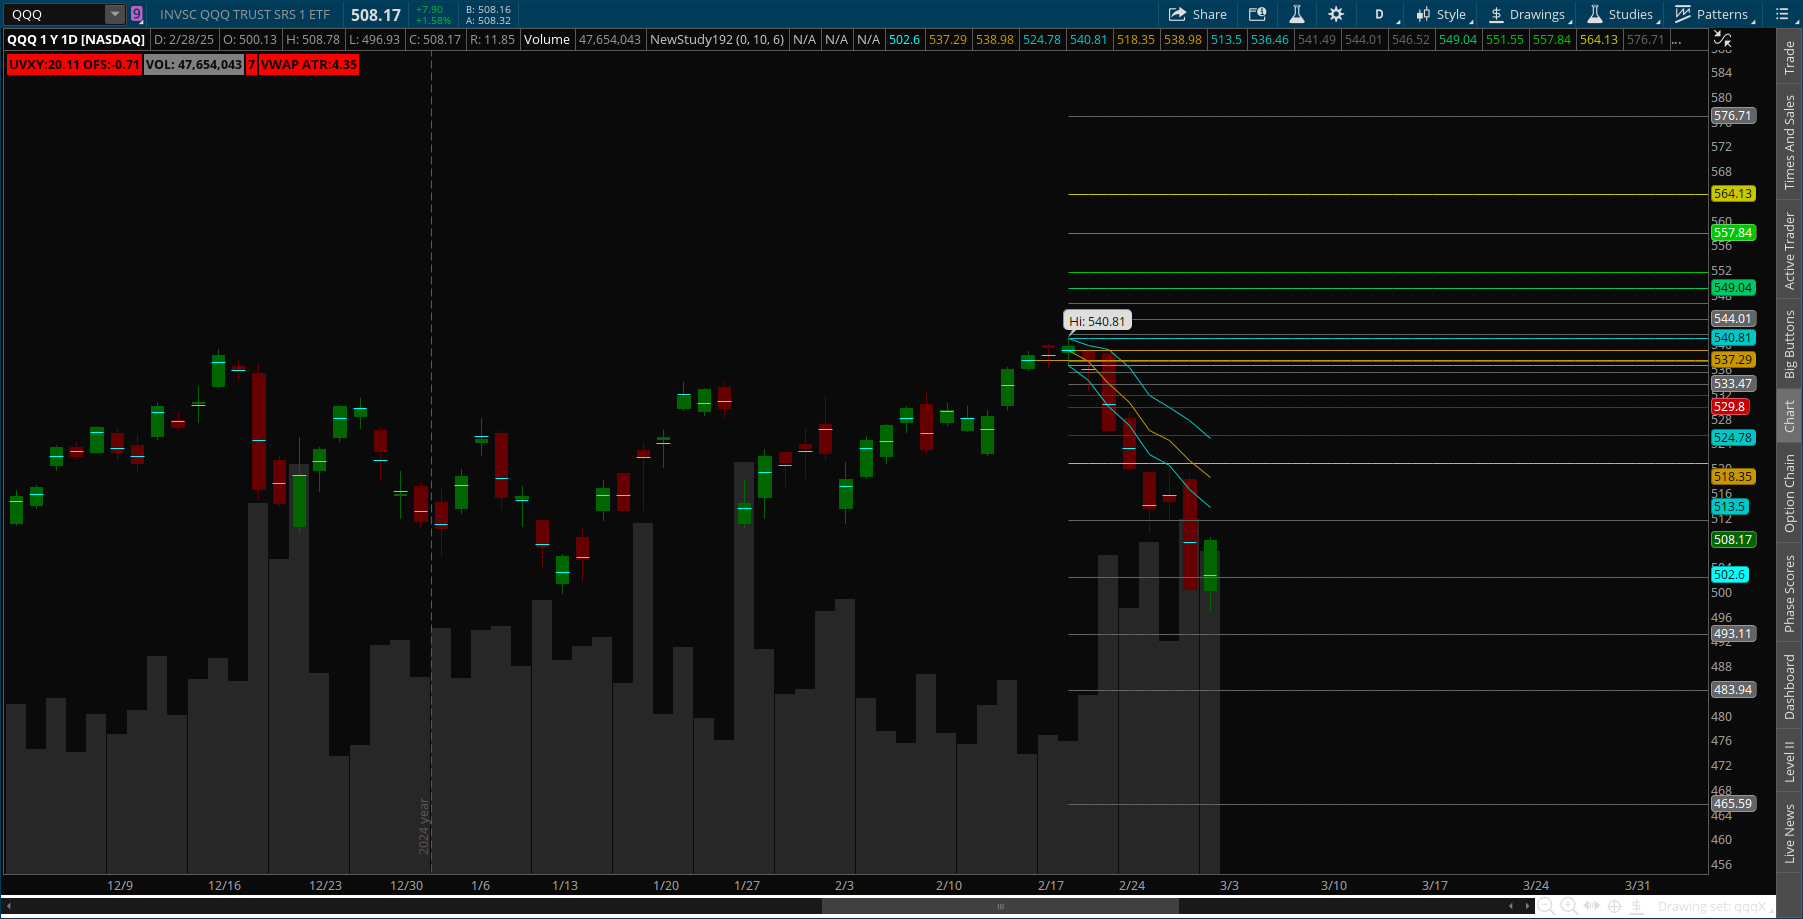
As shown in the example above, these tools can also be anchored to any specific candle in order to model out support and resistance, and VWAP trending sentiment. Note that the dominant support and resistance levels have recalibrated to reflect their new algorithmically derived price values.
Anchoring VWAP Pros and Cons

The Volume Weighted Average Price (VWAP) is a popular trading indicator that provides insight into the average price of a security, weighted by volume, over a specific period. Traders often "anchor" VWAP to a particular point in time (e.g., the start of the trading day, a specific session, or a custom period) to analyze price action relative to this benchmark. Deciding where to anchor VWAP involves trade-offs, and understanding the pros and cons can help optimize its use depending on your trading strategy.
Pros of Anchoring VWAP
Contextual Relevance
Pro: Anchoring VWAP to a specific point (e.g., the opening bell, a breakout, or a news event) aligns it with a meaningful reference point for your analysis or strategy.
Example: Anchoring to the start of the day provides a benchmark for institutional activity, as many funds use daily VWAP to evaluate execution quality.
Improved Trend Analysis
Pro: A custom anchor (e.g., the start of a trend or a key reversal) can highlight how price behaves relative to volume-weighted support or resistance over a specific period, offering clarity on momentum.
Example: Anchoring to a breakout point can help scalpers or swing traders assess whether the move is sustainable.
Flexibility for Short-Term Trading
Pro: Anchoring VWAP to a shorter timeframe (e.g., the start of an hour or a trading session) allows day traders to focus on intraday dynamics without noise from prior periods.
Example: A trader might anchor VWAP to the start of a high-volume period to scalp around intraday mean reversion.
Customization to Strategy
Pro: Anchoring VWAP to a point that matches your trading horizon (daily, weekly, or event-driven) makes it more actionable for your specific goals.
Example: A swing trader might anchor VWAP to the start of the week to capture multi-day trends.
Cons of Anchoring VWAP
Loss of Broader Context
Con: Anchoring to a narrow or arbitrary point ignores price and volume data outside that window, potentially missing the bigger picture.
Example: Anchoring to a single hour might overlook how the stock has traded over the full day, reducing VWAP’s reliability as a benchmark.
Subjectivity and Bias
Con: Choosing an anchor point introduces subjectivity, which can lead to overfitting or cherry-picking data to confirm a bias rather than reflecting true market behavior.
Example: Anchoring to a low-volume period might distort VWAP, making it less representative of institutional activity.
Reduced Consistency
Con: Frequently changing the anchor point can make it harder to compare VWAP across different periods or securities, reducing its usefulness as a standardized tool.
Example: If you anchor VWAP to random events daily, it becomes difficult to develop a consistent trading system.
Sensitivity to Volatility
Con: Anchoring VWAP to a volatile period (e.g., a gap or news spike) can skew the indicator, making it less reliable for mean-reversion strategies.
Example: Anchoring to the open during a massive gap might result in a VWAP level far from subsequent price action, rendering it irrelevant.
Key Considerations for Anchoring VWAP
Timeframe Alignment: Day traders often anchor to the session open (e.g., 9:30 AM EST for US markets), while longer-term traders might use weekly or monthly starts. The choice depends on your holding period.
Volume Patterns: Anchoring to a high-volume period (e.g., market open or close) typically makes VWAP more robust, as it reflects greater market participation.
Market Conditions: In trending markets, anchoring to the trend’s origin can highlight momentum, while in range-bound markets, a session-based anchor might better capture mean reversion.
Conclusion
Anchoring VWAP offers customization and precision but sacrifices universality and simplicity. The "best" anchor depends on your goals: daily VWAP anchored at the open is standard for institutional benchmarking, while custom anchors suit tactical or niche strategies. The trade-off is between tailoring the indicator to your needs and maintaining its objectivity as a market-wide reference. Experimentation and backtesting with your specific asset and timeframe can help determine the optimal approach.
VWAP=∑(Price×Volume)/∑(Volume)
